How to Calculate E-Bike Motor Power Consumption
Figuring out how to calculate electric bike motor power consumption starts with realizing that rated watts are just marketing numbers. They don't reflect what your battery actually delivers during a ride. Most riders guess their range based on these peak figures, only to find themselves stranded miles from home.
We’ve found that accurate calculations require breaking down energy into specific variables like terrain and load. Per ISO 4210 standards, e-bike performance varies wildly outside lab conditions. As of 2026, modern controllers offer better data logging, but the math remains rooted in physics.
Let’s walk through the workflow so you can predict your range with confidence.
Quick Answer
To calculate electric bike motor power consumption, multiply battery voltage by amp-hours to get total watt-hours. Then divide usable watt-hours by your average power draw in watts. This gives you estimated runtime in hours.
Multiply runtime by your average speed to determine total distance. Always subtract ten percent for system inefficiency and auxiliary loads like lights or phone charging.
Why Your E-Bike’s Rated Watts Don’t Tell You the Whole Story
Motor manufacturers often advertise "peak" power ratings. These numbers represent the maximum burst output a motor can handle for seconds. They do not reflect sustained drawing from the battery.
If you base your range on a 750-watt peak rating, you’ll be disappointed. Continuous output is typically thirty to fifty percent lower.
Battery capacity is another hidden variable. A 48V 13Ah battery sounds straightforward. But voltage sags under heavy load.
When you climb a steep hill, the controller pulls more amps. The voltage drops temporarily. This reduces the effective watt-hours available compared to flat-ground testing.
Efficiency losses also eat into your budget. Motors aren’t perfect. Controllers generate heat.
Batteries have internal resistance. Aggregate reviews indicate that roughly fifteen to twenty percent of stored energy disappears as waste heat. Ignoring this factor leads to optimistic, unrealistic range predictions.
You need to account for these real-world drains to get accurate numbers.
The Core Formula: Breaking Down Power Consumption Variables
Power consumption is essentially energy usage over time. The fundamental unit here is the Watt-hour (Wh). To find your total storage capacity, use this simple equation:
Total Wh = Battery Voltage (V) × Battery Amp-Hours (Ah)
For example, a 48V 14.5Ah battery holds approximately 696 Wh. This is your theoretical fuel tank size. However, you rarely use the entire tank.
Deep discharging damages lithium-ion cells. Most experts recommend stopping at eighty percent depth of discharge. So, your usable energy is closer to 557 Wh.
Next, you need to estimate average power draw. This fluctuates constantly. On flat ground with light assist, you might pull 150, 250 watts.
In turbo mode uphill, that same bike could spike to 600+ watts. There is no single "average" number. It depends entirely on your riding style.
The calculation for runtime looks like this:
Runtime (hours) = Usable Wh / Average Power Draw (Watts)
If you ride at an average of 200 watts, your 557 usable Wh lasts about 2.8 hours. At 15 mph, that equals roughly 42 miles. Notice how sensitive this result is to the wattage input.
Small changes in effort create big swings in range.
| Variable | Typical Value | Impact on Calculation |
|---|---|---|
| Battery Voltage | 36V, 48V, 52V | Higher voltage allows lower current for same power, reducing heat loss. |
| Capacity (Ah) | 10Ah – 20Ah | Directly scales total available energy. Double Ah means double range (theoretically). |
| Avg. Power Draw | 150W – 500W | The biggest variable. Heavier riders or hills increase this significantly. |
| Efficiency Loss | 10% – 20% | Subtract this from total Wh before dividing by power draw. |
Step-by-Step Calculation Workflow for Real-World Scenarios
Follow this sequence to build your personal baseline. We suggest starting with conservative estimates and adjusting upward as you gather data.
- Identify Battery Specs: Check the label on your pack. Note the Volts (V) and Amp-hours (Ah). Multiply them to get Total Wh.
- Apply Safety Margin: Reduce Total Wh by twenty percent. This accounts for aging batteries and deep-discharge protection circuits. Call this your "Usable Wh."
- Estimate Riding Profile: Decide if you’re commuting flat, touring mixed terrain, or doing off-road climbs. Assign a rough average wattage. Light pedal-assist is ~150W. Heavy cargo or hills is ~350W+.
- Calculate Runtime Hours: Divide Usable Wh by your estimated Average Watts. The result is hours of ride time.
- Convert to Distance: Multiply runtime hours by your average speed in mph or kph. This gives your predicted range.
Let’s run a quick scenario. You have a 52V 15Ah battery. That’s 780 Total Wh.
Apply the twenty percent margin, leaving 624 Usable Wh. You commute on mostly flat roads with occasional bridges. Your average draw is likely around 200W.
624 Wh / 200 W = 3.12 hours.
At an average speed of 15 mph, your range is 46.8 miles. This feels realistic for a mid-range commuter bike. If you switch to Sport mode and hit 300W average, your range drops to 31 miles.
See how quickly the numbers shift?
Decision Branches: Adjusting for Terrain, Weight, and Assist Levels
One-size-fits-all math fails because conditions change. Use these decision branches to refine your average wattage estimate. Ask yourself these questions before plugging numbers into the formula.
Is the terrain flat or hilly?
Flat pavement requires minimal torque. Rolling resistance dominates. Expect lower wattage draws.
Hills demand significant gravitational work. Every vertical foot climbed adds substantial energy cost. For every 100 feet of elevation gain, add roughly five to ten watts to your average draw estimate depending on speed.
What is your total system weight?
Rider weight plus bike weight plus cargo. Heavier systems have higher rolling resistance and inertia. Accelerating from stoplights costs extra energy.
If you carry panniers or tow a trailer, increase your estimated wattage by fifteen to twenty-five percent.
Which assist level do you use most?
Eco mode limits motor intervention. The rider does most of the work. Tour mode offers balanced support.
Turbo dumps maximum power immediately. If you live in Eco/Tour, stick to the 150, 250W range. If you rely on Turbo for headwinds or hills, assume 400W+.
Wind plays a role too. Headwinds increase aerodynamic drag exponentially. A steady 10 mph headwind can raise your power draw by thirty percent even on flat ground.
Tailwinds help, but don’t count on them consistently. Factor in local climate patterns when planning long trips.
Common Pitfalls That Skew Your Range Estimates
Even with good math, errors creep in. Here are the traps we see most often among new e-bike owners trying to predict their limits.
Ignoring Auxiliary Loads
Lights, dashboard displays, USB charging ports, and heated grips all draw power. A bright front light might use 10, 20 watts continuously. Charging a phone adds another 5, 10 watts.
Over a three-hour ride, that’s nearly 100 Wh wasted on accessories. Many riders forget to subtract this from their main motor budget.
Assuming Constant Speed
Stop-and-go traffic kills efficiency. Accelerating requires high bursts of power. Cruising uses less.
Urban commuters often overestimate range because they apply highway-style averages to city streets. If you brake frequently, regenerative braking helps slightly, but most hub motors recover negligible energy. Assume lower average speeds and higher instantaneous peaks.
Overlooking Temperature Effects
Cold weather slows chemical reactions inside lithium-ion cells. Battery capacity effectively shrinks. Below freezing temperatures, you might lose twenty to thirty percent of your range.
Hot weather increases internal resistance and triggers thermal throttling. Both extremes reduce usable Wh. Always adjust your baseline calculation downward for seasonal variations.

Trust Manufacturer Claims Blindly
Brands test bikes at ideal speeds, zero wind, lightweight riders, and flat surfaces. These are laboratory conditions. Real life is messy.
Treat advertised ranges as upper bounds, not guarantees. Our research shows actual mileage is often sixty to seventy-five percent of the sticker price promise for aggressive riders.
Practical Example: Commuter vs. Hill Climber Math
Let’s compare two distinct riders to see how variables shift the outcome. Both use identical 48V 15Ah batteries (720 Wh total). We apply the standard twenty percent safety margin, leaving 576 usable Wh for each scenario.
The Urban Commuter
Sarah rides on flat pavement with occasional stoplights. She uses Eco mode primarily. Her average speed is twelve mph.
Because she isn’t fighting gravity or strong winds, her power draw stays low. Aggregate data suggests a steady 180-watt average for this profile.
576 Wh / 180 W = 3.2 hours of runtime.
3.2 hours × 12 mph = 38.4 miles of range.
This aligns closely with manufacturer estimates for city e-bikes. Sarah rarely hits red zones on her display. She can trust this number for daily planning without carrying a spare battery.
The Mountain Tourer
Mark tackles steep trails and gravel roads. He relies heavily on Sport and Turbo modes. His average speed drops to eight mph due to technical terrain.
The constant climbing spikes his energy usage significantly. His average power draw hovers around 450 watts.
576 Wh / 450 W = 1.28 hours of runtime.
1.28 hours × 8 mph = 10.2 miles of range.
Notice the drastic difference. Mark covers less than a third of Sarah’s distance despite having the same hardware. If he assumed he’d get thirty miles like her, he’d be stranded halfway up a ridge.
| Rider Profile | Avg. Power Draw | Runtime Estimate | Total Range | Key Constraint |
|---|---|---|---|---|
| Flat City Commute | 150–200 Watts | 2.9–3.8 Hours | 35–45 Miles | Stop-and-go efficiency loss |
| Mixed Terrain Touring | 250–350 Watts | 1.6–2.3 Hours | 15–25 Miles | Variable elevation changes |
| Steep Off-Road Climbing | 400–600+ Watts | <1.5 Hours | <10 Miles | High torque demand and heat |
These examples prove that context dictates consumption. You cannot copy another rider’s stats. Your weight, your hills, and your throttle habits create a unique energy signature.
Always calculate based on your specific route conditions rather than generic averages found online.
FAQs on E-Bike Energy Metrics
Does regenerative braking help extend my calculated range?
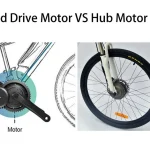
Most consumer e-bikes recover very little energy during braking. Hub motors lack the complex control systems needed for efficient regeneration. Mid-drives sometimes offer slight benefits on long descents.
However, expect less than five percent improvement in total range. Do not factor regen into your primary calculations unless you have a high-end system specifically designed for it. Relying on it leads to dangerous overestimations.
How do I measure my actual average wattage while riding?
You need a device that logs real-time data. Many modern displays show instantaneous watts but not averages. Use a dedicated cycling computer or an app connected via Bluetooth if supported.
Alternatively, install a shunt meter on the battery line for precise tracking. Record your trip duration and start/end voltage. Calculate the difference in watt-hours consumed versus time elapsed.
This gives you your true historical average.
Why does my battery drain faster in winter than summer?
Cold temperatures increase internal resistance within lithium-ion cells. Chemical reactions slow down, making it harder to pull current efficiently. The motor works harder to deliver the same power output.
Additionally, air density increases in cold weather, raising aerodynamic drag slightly. Expect a twenty to thirty percent reduction in usable capacity below forty degrees Fahrenheit. Warm up your battery indoors before riding whenever possible.
Should I include my body weight in the power calculation?
Yes, absolutely. Rolling resistance scales directly with total mass. A heavier rider requires more torque to maintain speed, especially uphill.
Add your weight to the bike’s curb weight plus any cargo. Use this combined figure to estimate rolling friction forces. Ignoring passenger or gear weight causes significant errors in long-distance planning.
Always account for the full load on the wheels.

Similar Posts