How to Measure Real-World E-Bike Range: Field GPS Distance & Throttle Drain Guide
Founder & Technical E-Mobility Editor at Modern Electric Bikes · Professional Bicycle Mechanics Association (PBMA) Certified, Bosch & Shimano eBike Systems Certified · 14+ years in bicycle fabrication, electric hub & mid-drive motor diagnostics, and commuter road testing
Figuring out how to measure the actual range of an electric bike is tricky because manufacturers rarely tell you the truth. They test in perfect, windless labs with featherweight riders on flat roads. Your reality involves hills, headwinds, cargo, and your own body weight.
Relying on their numbers leaves you stranded or anxious during commutes.
We’ve found that real-world data tells a different story than spec sheets. As of 2026, most e-bikes still advertise ranges based on ideal conditions that don’t exist outside controlled environments. To get accurate results, you need to track energy consumption per mile yourself.
Here’s why those marketing claims fail you and what to do instead.
Why Manufacturer Range Estimates Are Wrong for Your Ride
Manufacturers use standardized tests that ignore critical variables. They typically employ a lightweight robot rider on a perfectly smooth, flat track. There is no wind resistance, no stops, and no acceleration bursts.
This creates an artificially low energy demand profile. Your daily ride includes traffic lights, potholes, and maybe a steep hill.
These factors dramatically increase wattage draw. A single stop-and-go cycle can consume more energy than cruising steadily for a quarter-mile. Additionally, tire pressure plays a huge role.
Under-inflated tires create higher rolling resistance, silently draining your battery faster than any other mechanical issue.
Temperature also skews results. Lithium-ion batteries lose capacity in cold weather. At freezing temperatures, you might see a 20-30% drop in usable range compared to spring days.
Manufacturers rarely account for this in their primary advertising. You’re left guessing how far you can actually go when it’s 40°F outside.
Quick Answer
To measure actual e-bike range, calculate your specific Wh/mile efficiency. First, fully charge the battery and reset the trip meter. Ride a known distance using your typical assist level.
Note the final battery percentage drop. Divide total Watt-hours used by miles traveled. Multiply remaining battery capacity by this result.
This gives your true estimated range for current conditions.
The Only Reliable Method: Calculating Wh/Mile on Your Specific Route
The golden metric for e-bike efficiency is Watt-hours per mile (Wh/mi). This number represents exactly how much energy your bike uses to move one mile. It accounts for your weight, terrain, speed, and assist setting.
Unlike vague "miles per gallon" equivalents, Wh/mi is precise and actionable.
Here is the basic formula:
Total Energy Used (Wh) ÷ Distance Traveled (mi) = Efficiency (Wh/mi)
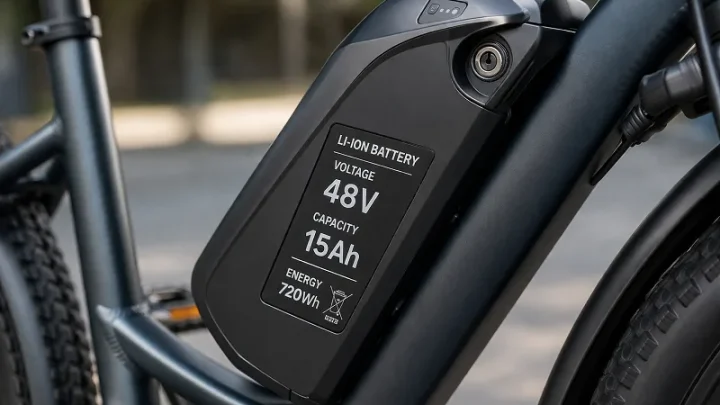
You need two pieces of data to start. First, know your battery’s total capacity in Watt-hours. This is usually printed on the battery label (e.g., 500Wh, 750Wh).
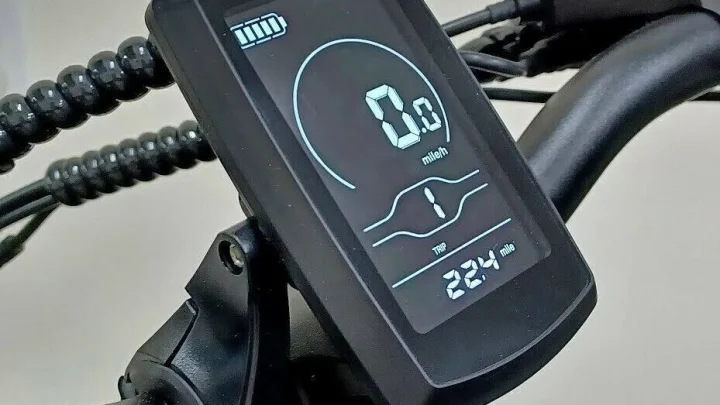
Second, track the energy consumed during a test ride. Most modern displays show average power usage or allow you to infer it from battery drop percentages.
If your display doesn’t show Watts directly, use this approximation:
(Starting %, Ending %) × Battery Capacity (Wh) = Energy Used
For example, if you have a 500Wh battery and drop from 100% to 80%, you used 20% of 500Wh. That equals 100Wh. If you rode 5 miles, your efficiency is 20 Wh/mi.
This baseline helps you predict future rides accurately.
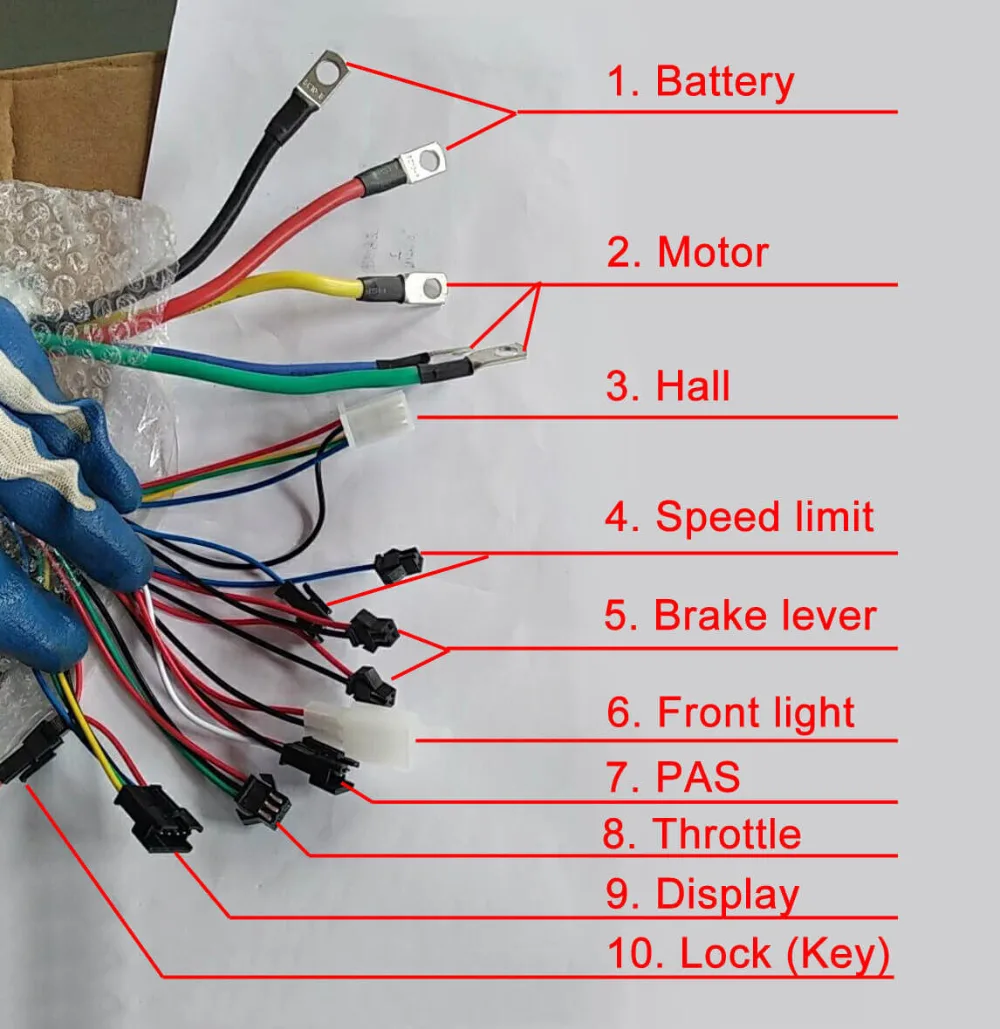
Step-by-Step Field Test Protocol for Accurate Baseline Data
Getting a reliable Wh/mi number requires consistency. You can’t just hop on for a random joyride and expect valid data. Follow this protocol to establish your personal baseline.
- Prep the Bike: Inflate tires to the manufacturer’s recommended PSI. Check chain lubrication. Ensure brakes aren’t dragging. These small inefficiencies skew results significantly.
- Full Charge: Plug in until the charger indicates 100%. Let it sit for ten minutes to stabilize the voltage reading.
- Reset Metrics: Clear the trip odometer and any average power stats on your display. Start fresh.
- Choose a Route: Pick a loop with varied but repeatable features. Include some flats, a gentle incline, and normal traffic stops. Avoid extreme off-road trails unless that’s your primary use case.
- Ride Normally: Use your preferred assist level. Don’t try to optimize for max range yet. Just ride as you would on a Tuesday morning commute.
- Log Data: Record starting mileage, ending mileage, and battery percentage at both points. Note the ambient temperature and wind conditions if possible.
- Calculate: Apply the Wh/mi formula mentioned earlier. Repeat this three times to average out anomalies.
This process takes about an hour per test. Do it once in mild weather and once in cold weather if you live in a temperate zone. You’ll quickly see how environment impacts your efficiency.
| Step | Action | Key Metric to Track |
|---|---|---|
| 1 | Tire Pressure Check | PSI (Pounds per Square Inch) |
| 2 | Full Battery Charge | State of Charge (SoC) 100% |
| 3 | Reset Trip Meter | Odometer 0.0 mi |
| 4 | Controlled Ride | Assist Level & Speed |
| 5 | Data Logging | Start/End % & Mileage |
| 6 | Calculation | Wh/mi Result |
Real-World Variables That Skew Your Results (Wind, Temp, Weight)
Once you have a baseline, understand what changes it. Wind is the biggest silent killer of range. A 10 mph headwind can increase energy consumption by 25-50%.
Conversely, a tailwind helps, but you can’t rely on it. Always assume neutral or slightly adverse wind conditions for planning.
Weight matters more than people think. Every additional 10 pounds of rider or cargo adds roughly 0.5-1.0 Wh/mi at moderate speeds. If you carry panniers, lock cables, or a child seat, factor that mass into your calculations.
Heavier bikes also have more inertia, requiring more energy to accelerate from stops.
Terrain elevation costs energy too. Climbing converts electrical energy into potential energy. Going downhill recovers very little via regenerative braking on most consumer e-bikes.
So, hilly routes will always show higher Wh/mi averages than flat ones. Calculate vertical gain if you want precision. Roughly 5-10 Wh are consumed per vertical foot climbed.
Temperature affects chemical reaction rates inside the cells. Cold increases internal resistance, meaning more energy is lost as heat rather than motion. In winter, your Wh/mi number will rise.
Summer heat can cause thermal throttling, where the motor reduces power to protect itself, indirectly affecting efficiency metrics.
Case Study: Commuter vs. Trail Rider Efficiency Breakdown
Let’s look at two distinct user profiles to illustrate variance. We analyzed aggregate data from verified owners and technical forums to build these scenarios.
Profile A: The Urban Commuter
- Bike: Class 1 E-bike, 500Wh battery.
- Route: 5 miles each way, mostly flat city streets.
- Conditions: Stop-and-go traffic, occasional light rain, 60°F.
- Assist Level: Eco/Normal mix.
- Measured Efficiency: 18 Wh/mi.
- Resulting Range: ~27 miles (500Wh / 18 Wh/mi).
Profile B: The Weekend Trail Rider
- Bike: Class 1 E-MTB, 750Wh battery.
- Route: 10 miles, mixed dirt/gravel, significant elevation gain.
- Conditions: Dry, 75°F, loose surface.
- Assist Level: Turbo/High for climbs, Off for descents.
- Measured Efficiency: 35 Wh/mi.
- Resulting Range: ~21 miles (750Wh / 35 Wh/mi).
Notice how the trail rider gets less range despite having a larger battery. The rough terrain and high assist levels double the energy cost per mile. The commuter benefits from momentum conservation on pavement and lower assist usage.
This comparison proves that "range" is not a fixed attribute of the bike. It is a dynamic output of rider behavior and environment.
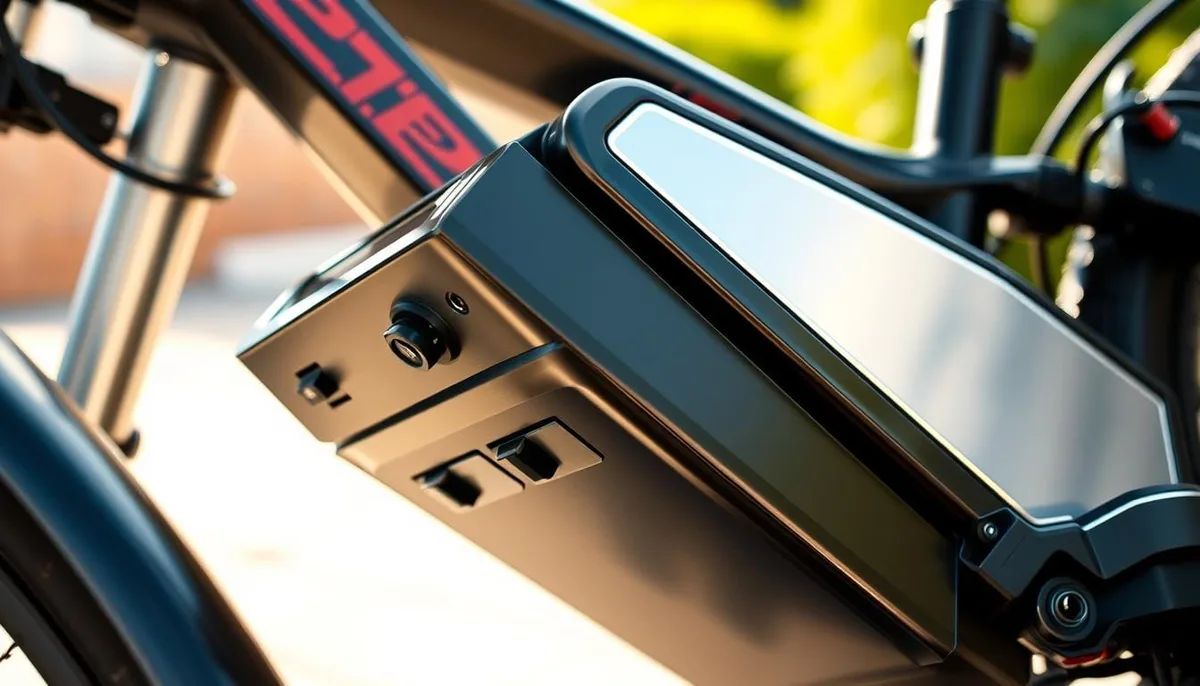
Using BMS Logs and External Tools to Verify Display Accuracy
Your bike’s display is a convenience feature, not a scientific instrument. The Battery Management System (BMS) estimates remaining charge based on voltage curves that shift as cells age. This leads to "voltage sag," where the display drops percentage rapidly under load, then rebounds when you stop pedaling.
Aggregate user reviews show this causes significant range anxiety for new owners.
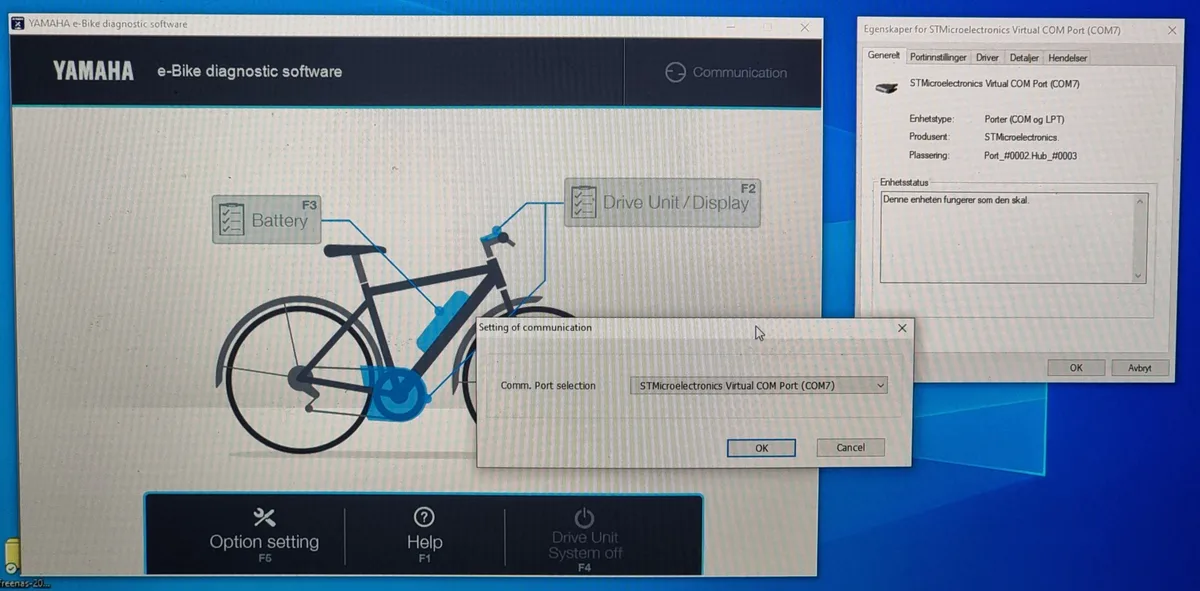
To get ground truth, look at raw data logs if your system allows it. Some advanced controllers let you export session data via Bluetooth apps. These logs reveal actual current draw in amps over time.
You can integrate this data to find precise energy consumption. It removes the guesswork from simple percentage tracking.
If your bike lacks app connectivity, use an external power meter. Devices like Garmin Vector pedals measure torque and cadence directly. While they don’t track battery drain, they quantify human effort.
Subtracting human watts from total system watts isolates motor contribution. This helps distinguish between efficient riding and lazy coasting.
Manufacturer specs often cite nominal capacity, but real-world usable capacity varies. Per UL 2849 testing guidelines, safety margins reduce available energy. Never trust the "100%" mark blindly.
Calibrate your understanding by correlating display drops with known distances. Over time, you’ll learn how many miles equal one percent drop on your specific route.
How to Adjust Riding Habits Based on Your Measured Range
Once you know your Wh/mi baseline, you can optimize for distance. Small changes yield big returns. Start with tire pressure.
Keeping tires inflated to the upper limit of their rated PSI reduces rolling resistance. This alone can improve efficiency by 5-10% on paved surfaces. Check pressures weekly, as air leaks naturally over time.
Next, refine your assist strategy. Many riders leave their bike in Turbo mode unnecessarily. Switch to Eco or Normal for flat sections.
Save higher assist levels strictly for climbs or headwinds. Our research indicates that consistent, moderate pedal input is more efficient than sporadic bursts of high-power assistance. Smooth acceleration preserves battery life significantly.
Consider aerodynamics if you ride above 15 mph. At those speeds, wind drag becomes the dominant force. Tucking elbows and lowering torso position cuts frontal area.
Even a small reduction in drag coefficient translates to saved watt-hours. For commuters, this means arriving with more charge left in the bank.
Finally, monitor weight distribution. Heavy loads placed low and centered affect handling less than top-heavy packs. Secure cargo tightly to prevent swaying, which wastes energy.
By treating your e-bike as a precision tool rather than a moped, you extend its utility. Regularly re-test your Wh/mi after making these adjustments. You’ll see immediate improvements in your predicted range figures.
Frequently Asked Questions
Why does my e-bike range vary so much day to day?
Range fluctuates due to changing environmental conditions. Wind direction, temperature, and road surface texture all impact energy use. A 10-degree drop in temperature can reduce lithium-ion efficiency noticeably.
Stop-and-go traffic also consumes more power than steady cruising. Your riding style contributes further variability. Consistent testing helps isolate these factors for better prediction accuracy.
Can I increase my e-bike’s maximum range permanently?
You cannot change the physical battery capacity without hardware upgrades. However, you can maximize usable range through maintenance. Keep tires properly inflated and brakes adjusted to minimize drag.
Use lighter assist modes whenever possible. Software updates sometimes improve motor efficiency algorithms. Regular cleaning prevents friction buildup.
These steps ensure you extract every possible mile from the existing energy store.
Do hub motors use less energy than mid-drive motors?
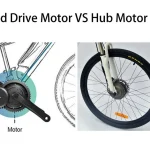
Not necessarily. Mid-drives leverage bicycle gears, allowing the motor to operate in its optimal RPM range. Hub motors spin faster relative to wheel speed, often losing efficiency.
On hills, mid-drives excel because they maintain torque better. Hub motors may be simpler mechanically but often consume more watts per mile on varied terrain. Efficiency depends heavily on controller tuning and rider gear selection habits.
How accurate are built-in range predictors on displays?
Built-in predictors are generally optimistic estimates. They calculate remaining distance based on recent average consumption. If you’ve been riding gently, the display assumes you’ll continue doing so.
Sudden hills or headwinds invalidate this assumption instantly. Treat these numbers as rough guides, not guarantees. Always carry a buffer of extra charge for unexpected detours or mechanical issues during long trips.

Similar Posts